How Can We Help?
How to Build a Multi-Class Prediction
Within Cortex, Future Event Pipelines allow you to predict the future behavior of your users. For example, you can easily predict the likelihood each user will purchase shoes in the next 7 days. This Machine Learning Pipeline allows you to select any event that you are tracking, and predict the likelihood each user will perform that specific action over a period of time. However, there are often times in which you want to compare the likelihood that a user will perform multiple actions, and choose the most likely action for each user. To continue the retail example of predicting users will purchase shoes, you can also predict the likelihood those same users will purchase shirts or pants. The question is then: “Which of these three item categories is a user most likely to purchase”, and the answer to this question will inform how best to market and communicate to each user.
This article will cover how to set up the required pipelines as well as how to compare the resulting prediction values.
Use Case Setup
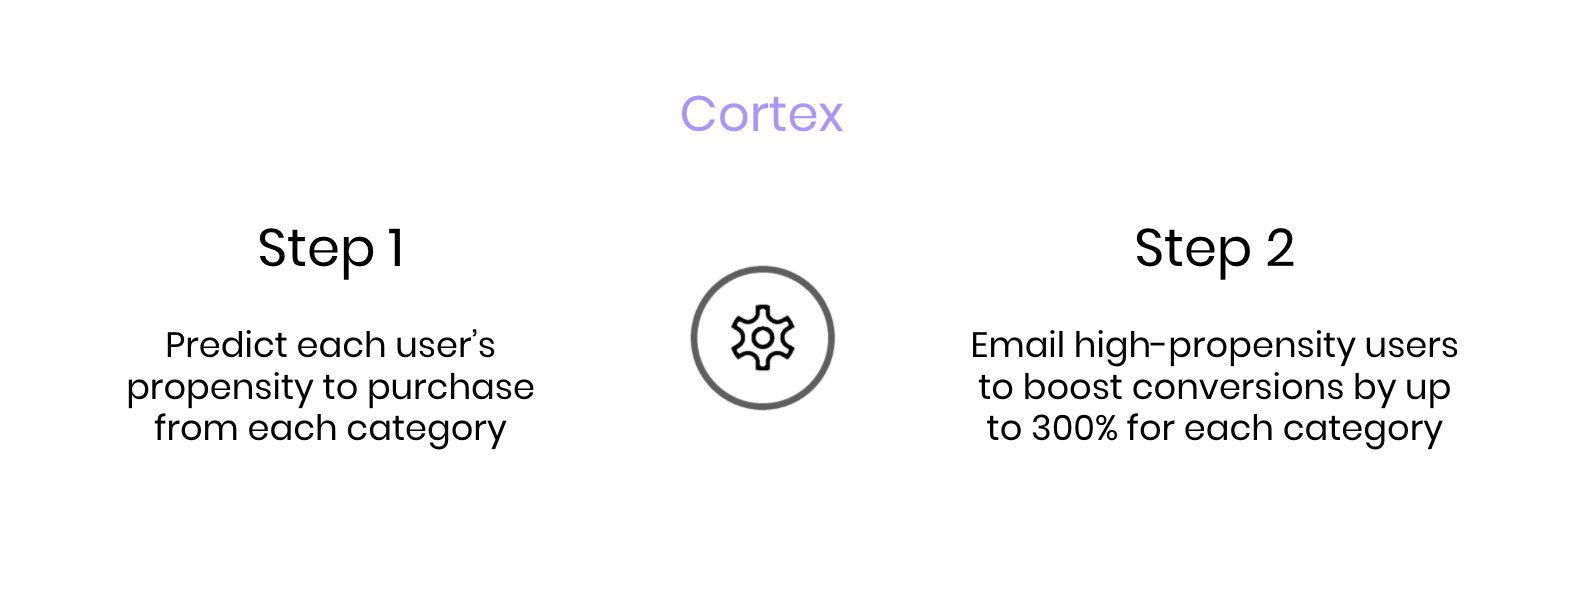
For this use case, we will assume we have 3 Item Categories that can be used in our marketing communication efforts. Our goal is to predict the likelihood each user will purchase an item from each of these three categories, and stack rank them in order to choose the single category each user will most like purchase. Once we have the most likely purchase category for each user, we can tailor our communications to highlight that specific category.
To accomplish this takes two steps
- First: We will setup Future Event Pipelines for each of the three categories, which will give us a 0-100% probability that each user will make a purchase from each category
- Second: We will compare the prediction results for the three pipelines, and select for each user the category with the highest likely conversion
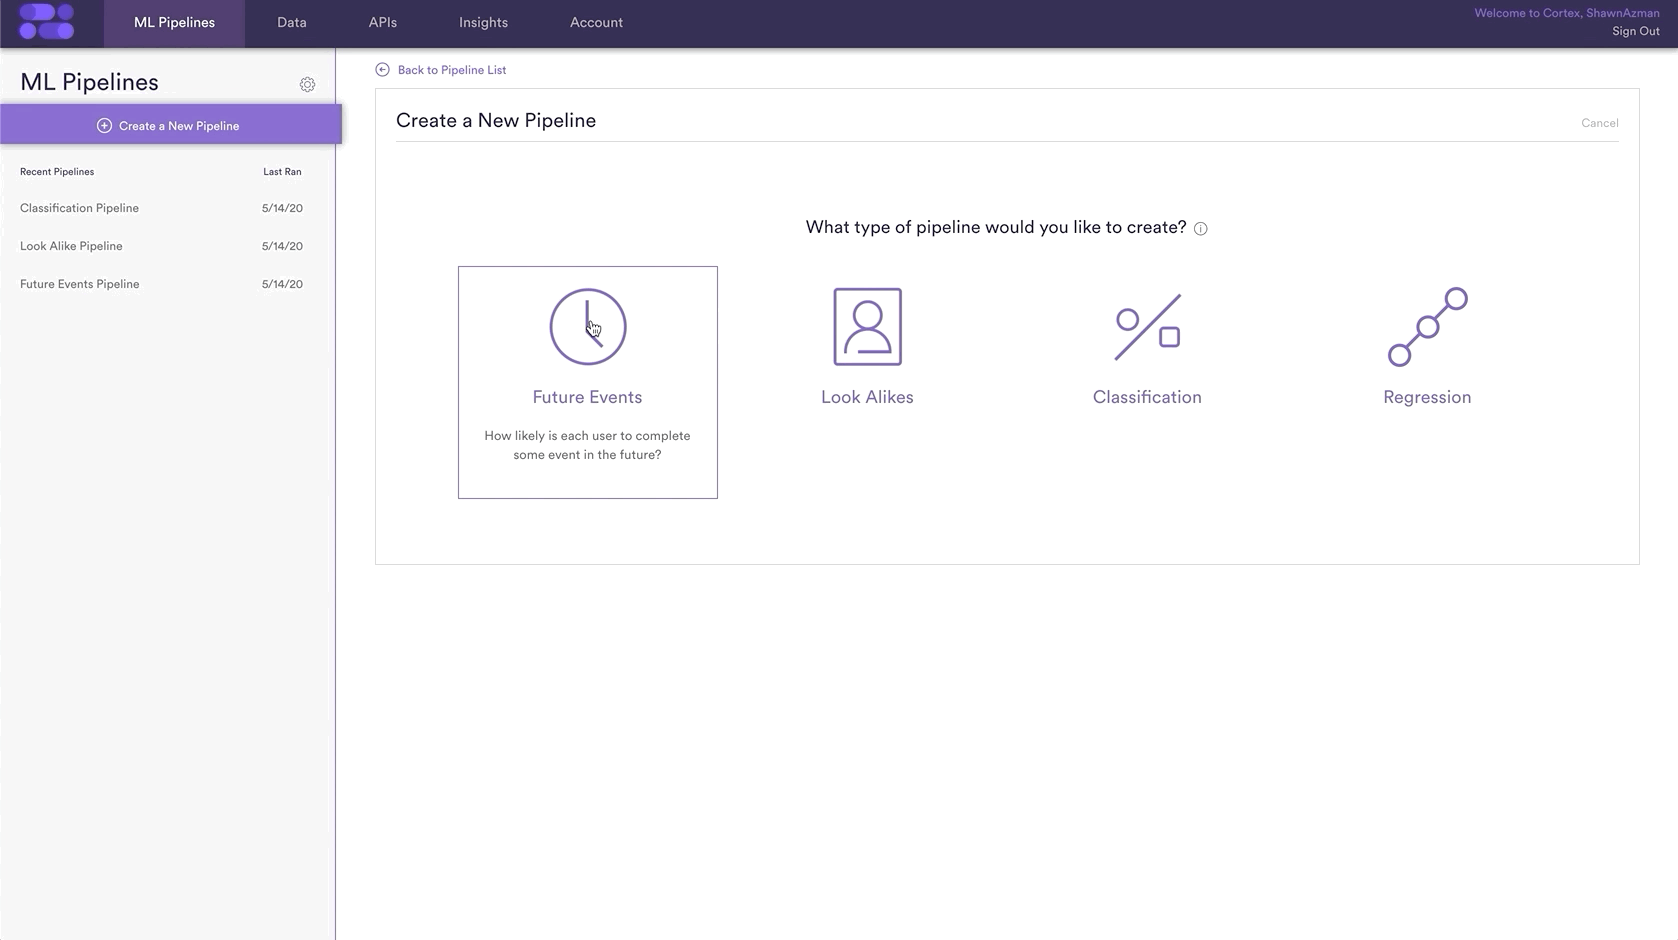
Step 1: Create Pipelines
The setup for the three Future Event Pipelines will be very similar, and the only thing that will change is the Category for which we are predicting. You can see an example of how to predict the purchase of a Category here, where you will see how to predict the purchase of Shoes in the next 7 days.
The most important part of the Pipeline setup is choosing the Category for prediction. As you can see in the following GIF, this is done in the Define Events step within your Future Events Pipeline. This requires that you are tracking a ‘Purchase’ event with an event parameter tracking Category, which for this prediction is Category=Shoes. The events you are predicting and the Item Categories you have may be different than shown here, but the process of creating the Pipeline will be the same.
Simply repeat this step for each of the 2 other Categories: Shirts and Pants.
Step 2: Compare Prediction Results
Once you have created each of your Pipelines, we can now compare the prediction values for each user to select the Category each is most likely to purchase. Each Pipeline will give a conversion probability percentage for each user, the export of which will look like:
Pipeline #1: Shoes
|
Pipeline #2: Shirts
|
Pipeline #3: Pants
|
Once we have our predictions, there are a few ways we can find the top category for each user
Automated Cortex Exports
For Pipelines that run continuously to ensure predictions are always up to date, the prediction values can automatically be exported out of Cortex. For these pipelines, Cortex will automatically compare each user across the 3 different pipelines, and create an output file which gives the top category for each user. An example of that output would be:
| user_id | top_category |
| user_1 | Pants |
| user_2 | Shirts |
| … | … |
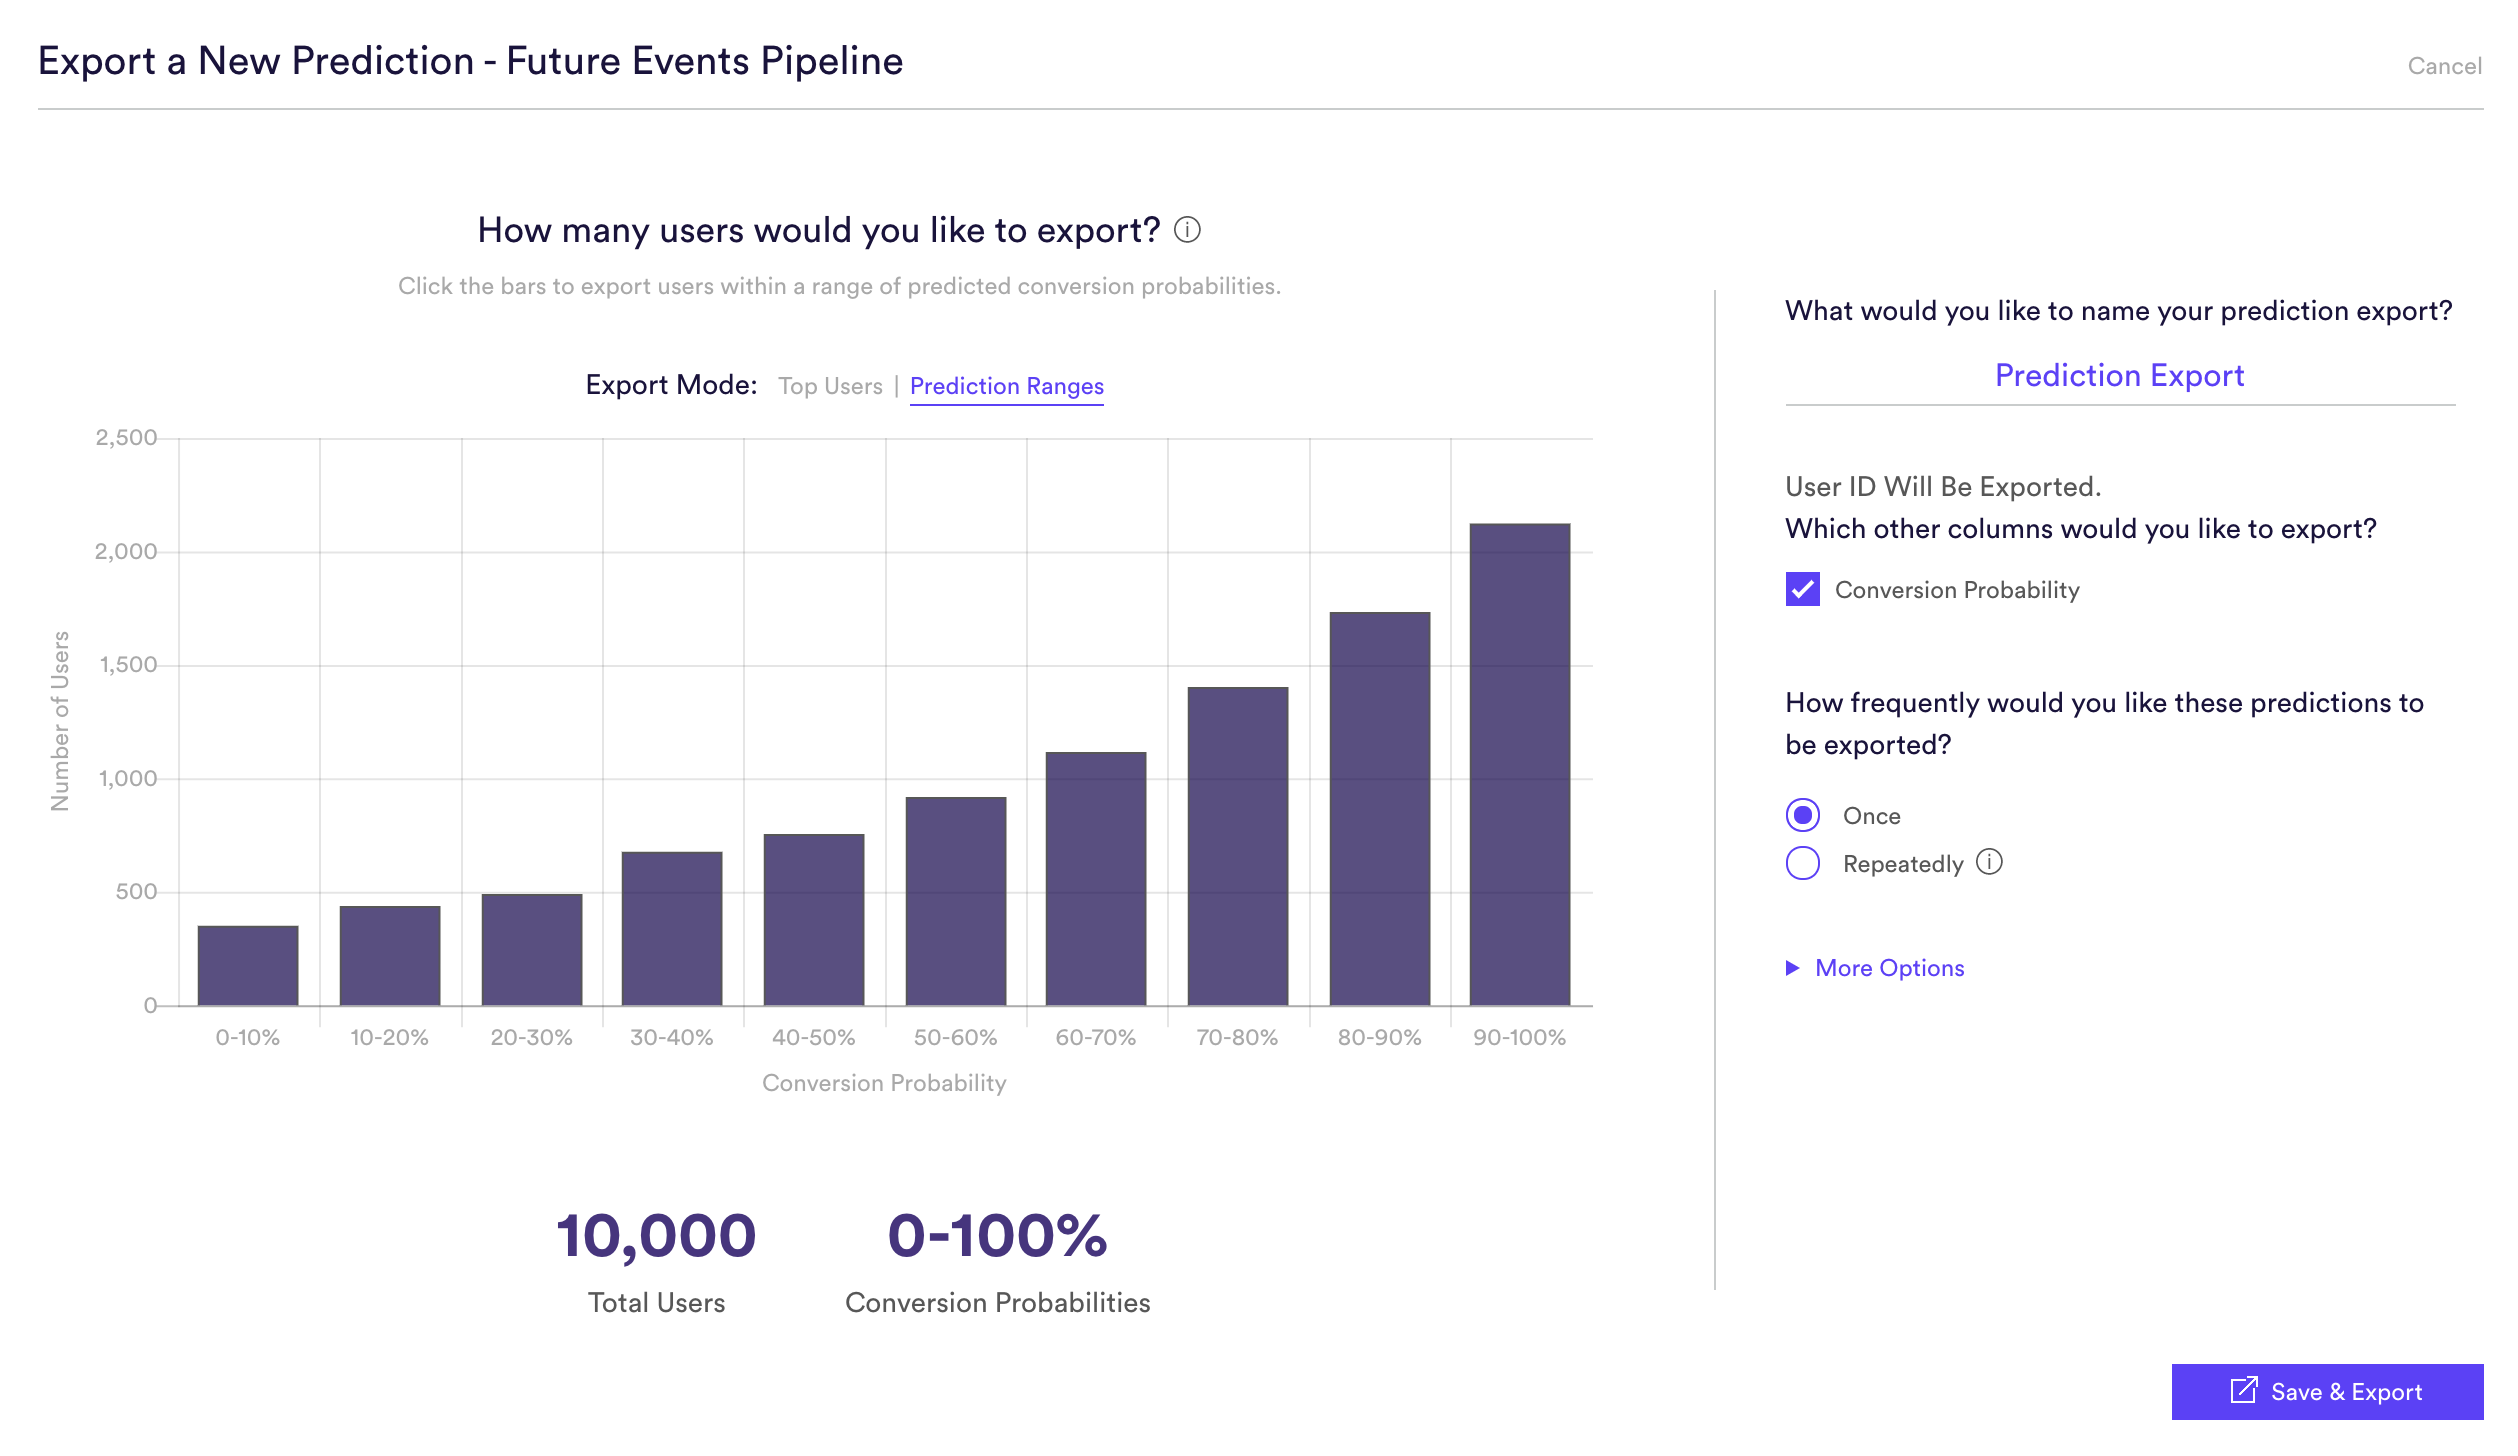
For this export, as with any export from Cortex, you can control which users, and the total number of users, who are included. For example, you can export only those users who are >50% likely for each pipeline. Or if you want you can choose to only export the top 5,000 users for each pipeline.
Cortex API
In order to use the Pipelines API first create a Prediction Export for each of the three pipelines. This will ensure that when we use the API, we will get the most up to date predictions for each user. If you plan on using this prediction on an ongoing basis, set the Prediction Export to recur and new probabilities will automatically be available through the API.
When using the API for this use case, we will need both the Pipeline IDs and the Export IDs for each pipeline.
- Pipeline IDs: There are two ways to get a Pipeline ID. First is to login to your Cortex account and navigate to the Results page for each pipeline. There, look at the URL to find the Pipeline ID (https://app.vidora.com/#!/pipelines/<PIPELINE_ID>). Additionally, you can get Pipeline IDs from the Get Pipelines API. Simply match up the name of your Pipelines to the IDs in the API Response.
- Export IDs: Similar to the Pipeline IDs, you can retrieve the Export IDs through the List Prediction Exports API. Each export you create in Cortex will be assigned a Unique ID. Every time that pipeline is re-run, the update predictions will be available using the same Export ID. However, if you wanted to create a separate and distinct export, for example one that exports only a subset of users vs all users, that Export will have it’s own Unique ID to access the prediction values.
With these Pipeline and Export IDs, we will use the Get Export Prediction API to get the conversion probabilities for each user, and compare their probability for each pipeline. By comparing which conversion probability is higher, we can label each user with a Top Category. In our example, that would be ‘Shoes’, ‘Shirts’, or ‘Pants’.
Here is an example of using the Pipelines API to determine the best action for each user.
CSV Export from Cortex
For Pipelines that aren’t automated, you can still perform the same analysis yourself. The first step is to export a CSV of the predictions for each user locally, which you can do from the Results page of each Pipeline. After you’ve exported the conversion probabilities for each pipeline, you will have 3 CSVs, 1 for each prediction.
Once we have our 3 CSV files, we can compare the results to find the best category for each user. There are many ways to accomplish this, and here we will cover how to do this comparison in Google Docs as well as Excel.
Google Docs & Excel
This comparison can be done in either Google Docs or Excel, as the process will be the exact same for both! Below we will show examples from Google Docs, but know you can perform the same tasks in excel as well.
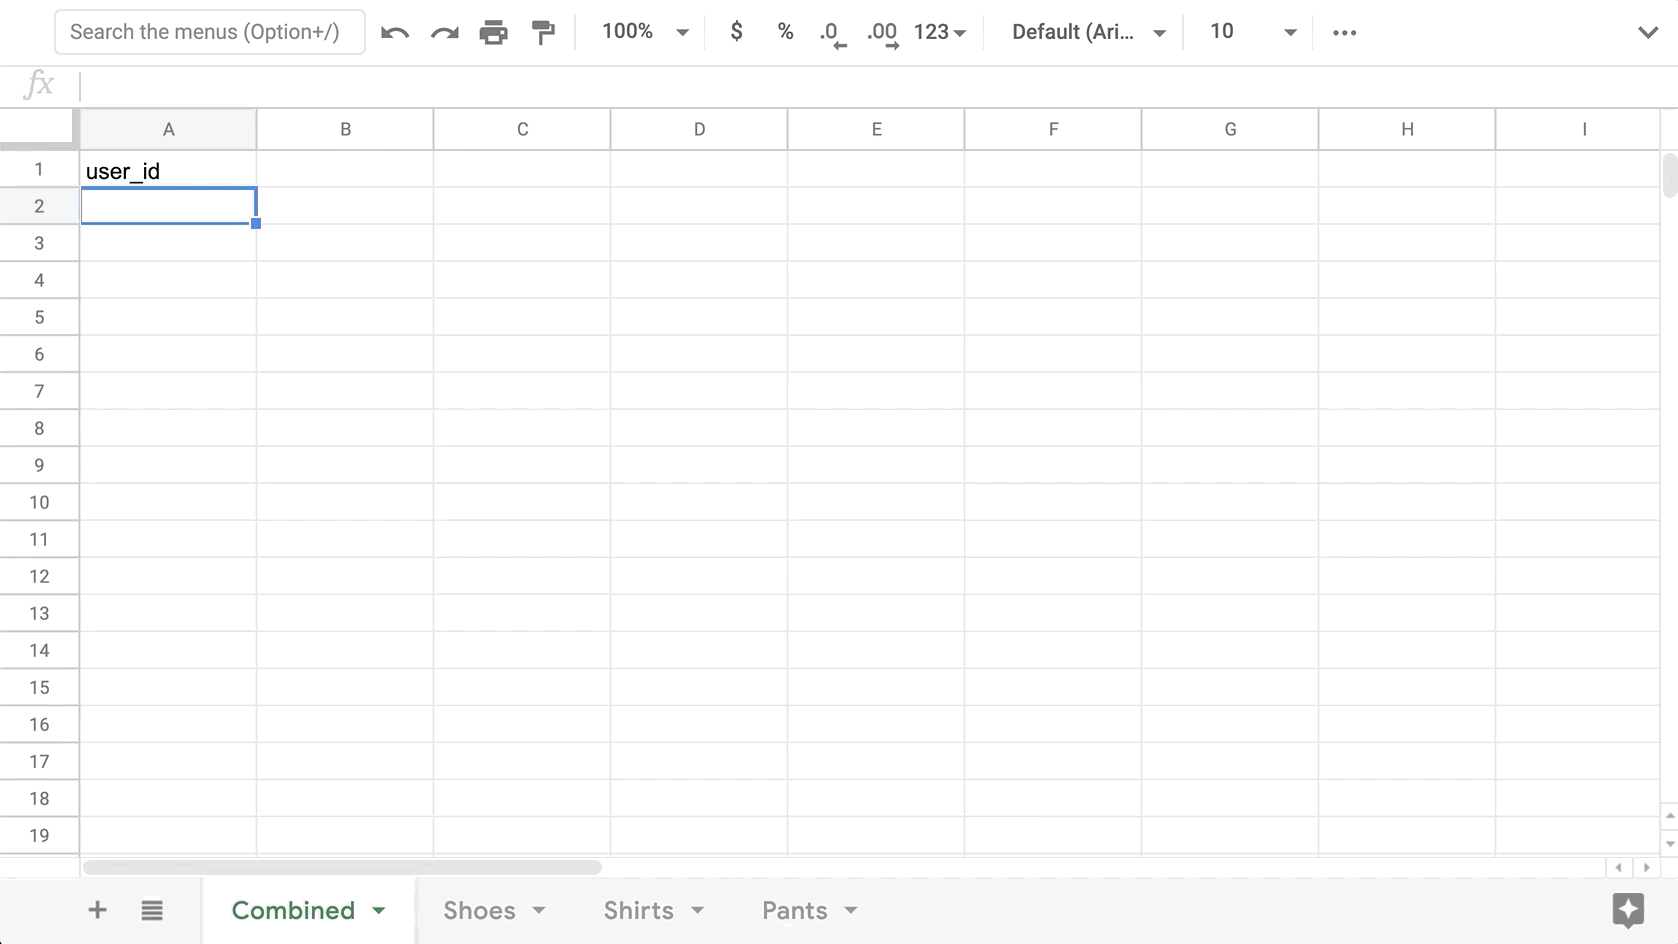
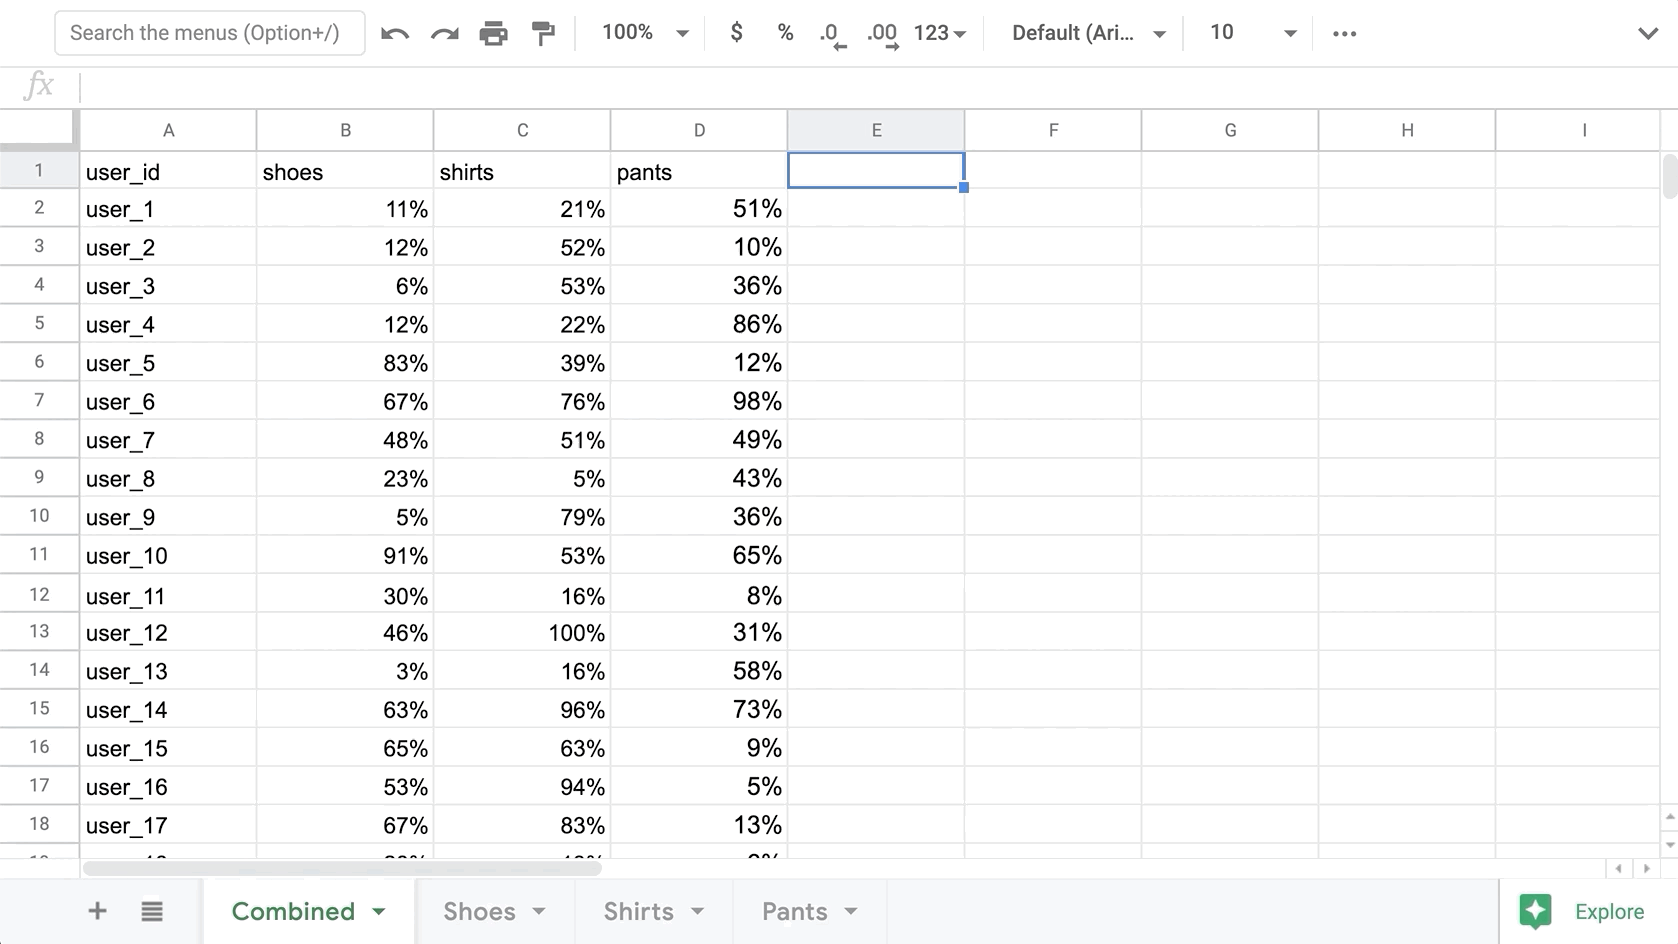
The first step is to create a Google Sheet with 4 tabs: Combined, Shoes, Shirts, Pants. In the Shoes/Shirts/Pants tabs, simply copy & paste over the corresponding CSV files into each. Once we have all our conversion probabilities in the doc, we can switch to the Combined tab where we will aggregate each prediction, and choose the top category for each user.
First, we will get all the User IDs from one of the exports. Since this prediction was made for every user, each export will contain conversion probabilities for each user, thus we only need to copy the IDs from one tab. Here is a quick formula to grab all User IDs from the Shoes tab (excluding the header value of “user_id”)
=filter(Shoes!A:A,Shoes!A:A<>"user_id")
Once we have all the User IDs, we need to bring over the corresponding conversion for each category. Similar to getting the user IDs, we will use the Filter function to get the corresponding conversion probability for the User ID in each row.
=filter(Shoes!B:B,eq(Shoes!A:A,A2))

Finally, we need to find the conversion that has the highest probability for each user. To do this, we will first find the maximum value of the 3 categories, then based on that value we will select the corresponding Category value from the header. The result will be 1 category chosen per user which represents the category with the highest likelihood of being purchased by that user.
=filter(B$1:D$1,eq(B2:D2,max(B2:D2)))
Related Links
- What is a Machine Learning Pipeline?
- How to Build a Future Events Pipeline
- How to Build a Look Alike Pipeline
- How to Build a Classification Pipeline
- How to Build a Regression Pipeline
Still have questions? Reach out to support@vidora.com for more info!