For many organizations, the concept of using Machine Learning (ML) to improve business results is still new. And whenever something is new, there is natural hesitation around the change. We may be unsure that the ML Model we’re using is producing predictions that are accurate. Once we are comfortable with the Model’s accuracy, we may be unsure that this additional information will improve our business over the current status quo.
We at Vidora work closely with our customers to answer these two important questions when deploying new ML Models:
- Are these predictions accurate?
- Can using these predictions improve my business results?
In this post, the first of 2, we will overview how Vidora helps customers understand the accuracy of every prediction. In the second post, we’ll discuss how to A/B Test these predictions to see if they improve our business results.
Are my Predictions Accurate?
Vidora helps automate predictions for a variety of companies and use cases, ranging from predicting purchase behavior for a retail company, finding likely homebuyers for a real estate company, or predicting the likelihood a media user cancels their subscription. Regardless of the use case, each company wants to ensure these predictions are accurately representing the state of their customers.
This is why, for every Future Events Pipeline (e.g. Churn or Purchase Predictions) created and trained with Vidora, we automatically measure the accuracy of our predictions without our customers needing to do anything! We are able to do this because customers are sending us a continuous stream of data, both before and after the predictions were made. This means, if we are trying to predict which users will subscribe to a service, we know what leads to previous customers subscribing. After we make our predictions we’re able to measure whether which of those customers actually subscribed.
With this information, you can know if the predictions made turned out to accurately predict the future behavior of our customers. This happens in two main ways:
Area Under the Curve (AUC)
AUC, or Area Under the Curve, is one of the most common ways to measure a ML Model’s accuracy for classification pipelines. It is often represented as a 0-100%, with the higher the AUC the better the prediction.
To give an example, let’s say we’re trying to predict whether a customer will subscribe or not. We will train our model on past customer data, but we will exclude a certain percentage from the training set.
This is done to test the predictions we are making and where the AUC measurement comes from. At the end of training, we will look at the predictions accuracy based on the historic data of these excluded customers. Specifically measuring how accurate the Model is at predicting “No, the customer will not subscribe” when they actually didn’t, and “Yes, the customer will subscribe” when the did. If the model accurately predicted “Yes” only for customers who subscribed, and “No” for the rest, the AUC would be 100%. If there are a lot of false positives and negatives, then the AUC will drop. (Note that in Vidora, you can always choose to export only customers with high probability of conversion. This is an easy way to ensure you’re only getting the highest likelihood customers, avoiding false positives.)
Every time you run a Pipeline in Vidora, check your AUC to ensure you have high confidence in your predictions!
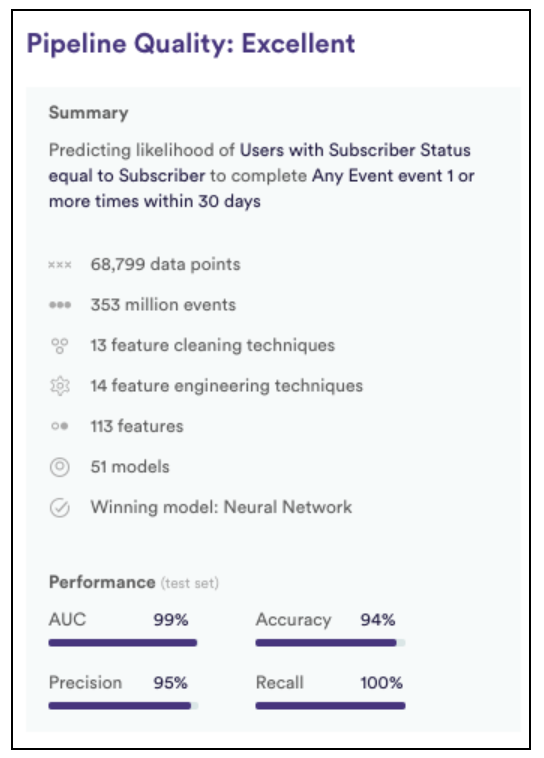
Example Summary of a Pipeline after training, including the AUC score
Propensity Cohort Analysis
For every prediction we make, we will automatically cohort customers into 3 groups:
- High Propensity: The top 10% of Vidora’s customer predictions
- Low Propensity: The bottom 10% of Vidora’s customer predictions
- Control: A random 10% of the customers
With these cohorts defined, we will measure the actual activity of those users for the 30 days after the Predictions are made. And this view will clearly show if Vidora’s predictions were accurate based on the customers’ actual behavior. This is a great way to analyze models as it’s clear even to non-Data Scientists if the Predictions were accurate. Vidora is in a unique place to give these results, as our Models are trained and updated on a continuous stream of data. This means we can both train model on historic data and measure results with ongoing data streaming into our platform.
The expected behavior is to see the High Propensity cohort converting at a higher rate than the Control, which converts at a higher rate than the Low Propensity. If this is not the case, it means the model is not accurately predicting the future behavior of these customers.
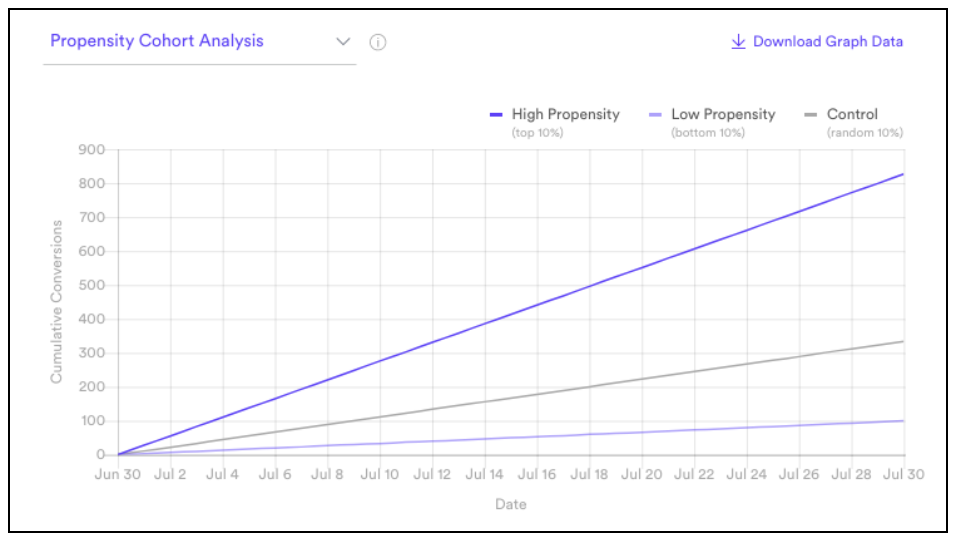
Example results from a Vidora Prediction:
Proving that those customers most likely to convert actually did convert more than the Control and Low Propensity cohorts
Summary
Vidora can help you understand the accuracy of your models automatically. Specially without you having to do anything besides create the Pipeline. We’ll soon be posting a follow up to this blog. The next post will dive into detail around how to A/B Test these predictions. Stay tuned!