Watch our ongoing series on how automated machine learning can accelerate personalization strategies and ROI for enterprise marketers and product managers.
Predicting and preventing churn during turbulent market conditions [Part 2]
Data Science and AI projects have traditionally been plagued by bottlenecks, not only with data pre-processing and feature engineering / labeling, but also in the traditional R&D phase where data scientists back-test and select the best predictive models.
At business speed in today’s rapidly shifting environment, this can mean final results no longer even reflect the latest market conditions.
C-levels lose patience, internal teams lose credibility, and businesses ultimately lose out by failing to adopt and enable AI within their organizations. AI 2.0 changes this calculus. It removes the time-to-launch for predictions, and it provides immediate transparency on results.
In Part 1, we walked through an interface that empowered any business user to setup and run a prediction in minutes.
In Part 2, we’ll walk through verifying results and using the data to inform immediate action.

Contact
Contact us using the form below to learn more about Vidora. We’re excited to hear from you!
—Read the full interview below—
—Interpreting Predictions—
Aaron Huang:
Okay. Shawn, thanks for walking us through the user interface. Number one, it looks super simple to actually set up a pipeline now that the data is ingested. I’m interested in, as a business user, to see the results, both, of the model, some correlation with the actual events, in this case churn that I’m trying to predict, but also some of the output files that we had talked about earlier in terms of the actual final data flow. So let’s review that if we can.
Shawn Azman:
Let’s go into the results of a prediction that’s already been created, and walk through from start to finish how this process works. Because as you mentioned, the first step is to create the features that then train your model. That’s going to include selecting the best model and algorithm for this particular prediction. Then obviously you need to use the result of that prediction, which is our per user conversion rates. We want to then export those and maybe use those in a marketing campaign. So let’s talk about both.
Shawn Azman:
The first place that I’ll go is within pipeline discovery, because as you mentioned, one of the key automations that Cortex provides is the creation of features. This happens for every single pipeline that’s created. You can see here we’re creating features off the active days for each user, as well as for every single event that’s being tracked. It’s not just that a user performed an action. It’s how many times did that action happen over the last week, over the last 14 days, over the last 30 days? So each single event is going to create multiple different features. What you’re going to see in the pipeline discovery is a relative importance and impact for each of these features on this specific prediction. So a reminder, we’re trying to predict churn, and what features are giving us is for each of these features in our data set, which has the highest predictive value in terms of predicting churn.
Shawn Azman:
As we can see here, a user registering for the service is extremely important in this prediction, but a user simply performing a search within the site, not too predictive. And so if we wanted to say impact churn in the greatest way possible, that’s where you would look at impact. Getting a user to register more is going to increase their likelihood for this prediction, whereas getting them to search relatively is not going to increase their likelihood that much. So this helps you understand how the data that you’re sending into Cortex is, first off, being turned into features, and second off, which of those features are most important to this model.
Shawn Azman:
To talk about the model, we can go into Model Selection. You can see that there’s a few different models that we’re going to test. For logical regression, which was for this case, the Winning Model, you can see that we tested 12 different models. Really, what that means is that every time you test a machine learning model, there’s different settings that you can have, what we call hyper parameters to that model that you can set before the training even happens. We’re going to do that automatically for you. We tested 12 different sets of hyper parameters for the logistical regression specifically to find the one that has the highest predictive value.
Aaron Huang:
I would also imagine if you had a data scientist on staff that this will also help to verify some of the veracity of the actual model selection being done.
Shawn Azman:
Absolutely. For those more advanced users, maybe those ones who are more familiar with creating features, creating models, training algorithms, you can actually export the features being created by Vidora on a per user basis if you wanted to then feed those into your own models. Again, that’s a more advanced use case. Typically customers want to be able to create predictions through a Wiziwig interface as you’re seeing here. But that’s absolutely an option and something that a lot of our customers take advantage of.
Shawn Azman:
What you’re going to see here is we tested 49 different models. Each of those models is going to get a score. What we’re looking for specifically is a higher score, which means, in our case, a higher predictive value. That’s how we chose logistical regression. So if you look at our Winning Pipeline, we can see all of the data that went into it, including the win winning. But you also asked about how do I prove that these predictions are correct? Because what we did in training the model is we try to learn off past data. So if you consider, we’re going to take a majority of the past data that has been given to cortex, and we’re going to siphon off a little bit and create what we call a holdout set. We’re going to train our algorithm on most of the data. Then once we have something that we think is highly predictive, we’re going to take that holdout set and run the prediction on that holdout set as if we had the prediction in the past. That’s exactly how we’re telling if our model that’s been trained on past data is predictive.
Shawn Azman:
However, future data can look different than past data. So it’s not only important that we test it on past data, but it’s important that we check our predictions on data that’s going to come into the platform after we’ve made the prediction.
Shawn Azman:
So let’s talk about how we actually use these predictions and how we can prove that they’re accurate. The first thing that I’ll point out is what we call a Propensity Cohort Analysis. For every future events prediction that you’re going to create, we’re going to create this graph. Initially, it’s going to be blank because there’s no data that we’ve had after we’ve created this prediction. However, for every day after the prediction’s been made, this chart will be updated. We’ll be checking three specific groups of users. Our high propensity cohort, or the top 10% users who are most likely to create this conversion based on Cortex’s predictions, the lowest 10%, as well as a random control. The idea is to see if our high propensity users are actually converting more than our low propensity and our control group. So here’s our control in the middle, and our low propensity at the bottom. That’s just one way to ensure that the predictions that we made are actually accurate and representative of our user’s behavior into the future.
Aaron Huang:
Got it.
—Verifying and Interpreting Results, Data Extraction—
Shawn Azman:
The final step of a machine learning pipeline is to get the prediction so that we can actually take action on them. Knowing that a user are going to churn, not very important, unless we can actually do something about it. So let’s find out how we can do that.
Shawn Azman:
We can choose to export predictions. We had talked a little bit about this before in that predictions can either be exported automatically or ad hoc. I’ll show you how to do this ad hoc, but just know that this can be something that can be set up to happen every single time we’ve retrained our prediction pipeline.
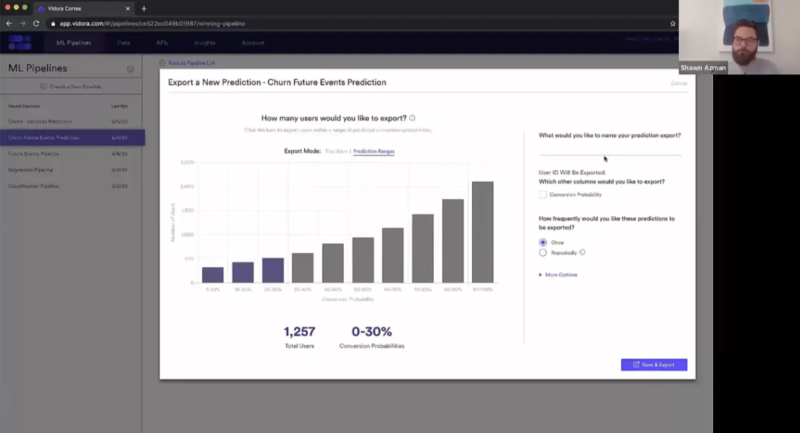
Shawn Azman:
But let’s reset this prediction. Here, we’re looking at churn future events prediction. Remember, what we’re predicting is the likelihood for every single user that they’ll take any action within the next 30 days. So with that, if you have a 90 to 100% probability for this pipeline, what that means is we’re very confident that you’re going to reengage within the next 30 days. For these users, if we’re trying to, say, do a churn prevention, there’s really nothing to prevent. It’s very likely that they’re going to reengage.
Shawn Azman:
Versus our users who are, say, zero to 10% all the way up to 30%. If you are 30% or less likely to take an action in the next 30 days, you’re probably pretty likely to be on the verge of churning from the surface. So maybe it’s these kinds of users that I want to reach. Say I’m a marketer, and I’m running an email campaign. I want it to specifically reach out to users that I think can prevent from a churn. So this is going to be my churn less than 30%. I don’t need to include my conversion probability because that’s built into my export. However, if I were exporting every single user, I probably would want that conversion probability to do some additional segmentation after the export. Here, I can choose to export this once or repeatedly. Again, if your pipeline is rerunning every week, you might as well re-export the prediction every week. That way, you always have the most up-to-date values. That’s really all you have to do. You can save and export this, and give it some time for the system to gather these results. The result is going to be a CSV file of user IDs that fit this description that are 30% or less likely to take an action in the next 30 days. Here, we have a user group of 1,250 users, and this will be now the segment cohort for our email campaign.
Aaron Huang:
Gotcha. That’s awesome, Shawn. This seems super simple. Thanks for the very thorough walkthrough. I look forward to actually talking to you about a bunch of other use cases that we’ve been discussing. So hopefully people will be jumping back in and watching another demo here. Thanks a lot.
Shawn Azman:
Yeah, definitely. Happy to talk to you soon.