
When it comes to classification models in machine learning, a common hurdle for many businesses is how to take what seem like arbitrary scores from their machine learning pipeline’s model output and translate them into human interpretable numbers that can be used in practice. Let’s say a retail company wants to predict which existing customers are going to purchase pants in the next 30 days. Once the model has been trained, predictive scores are prepared for each of those customers. However, those scores are only relative to one another. Let’s say customer A has a score of 0.1 and customer B has a score of 0.2. Given this, you can only deduce that customer B is more likely than customer A to purchase. However, what it will not tell you is how likely either is to purchase.
Comparing Scores Across Models
The hurdle becomes even bigger when you want to compare scores across models. Let’s look to the example above. Suppose that the business wants to predict which existing customers are going to purchase shirts in the next 30 days. Then let’s say they want to segment customers. One group has customers likely to purchase pants into one group, and the other has customers likely to purchase shirts. Keep in mind that a customer might be likely to purchase both shirts and pants.
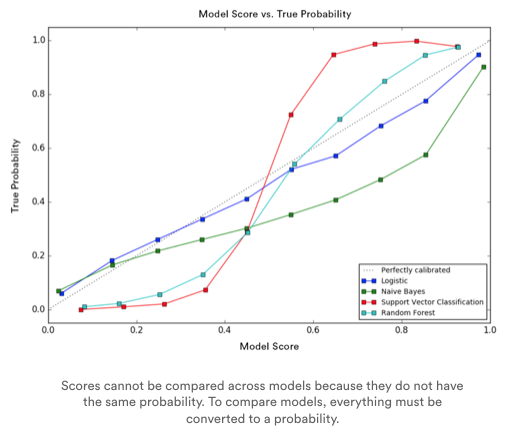
So what are they more likely to purchase? You will not get the results you want if you just use the direct output of the model. This is because scores generated by one model cannot be compared to the scores of the other, since the scores of each model are relative. This means a model score of 0.1 for pants is not equal to a model score of 0.1 for shirts.
Converting Model Scores into Probabilities
Unfortunately, the issues mentioned above push many businesses to devise their own solutions for comparing and ranking scores. This can therefore result in assumptions, and ultimately, low performance. Vidora has encountered these pitfalls as well. That’s why we’ve taken important steps to address them.
Our solution? Convert model scores into real life probabilities that can be understood by humans, compared across pipelines, and exported for deployment. Referring back to the example above, instead of exporting an arbitrary model score of 0.1 for customer A’s propensity to purchase pants, you can export an actual probability, for example 30%, that customer A is going to purchase pants.
This probability is much more meaningful when it comes to anticipating ROI. If running a marketing campaign, it’s much simpler to think about marketing spend if you roughly know that there is a 30% likelihood that a customer will convert. And comparing probabilities across different pipeline’s model output now becomes much simpler as well. If customer A has a 30% probability of buying pants and a 60% probability of buying shirts, it becomes clearer that customer A should be sold shirts instead of pants. By using probabilities, businesses can replace ineffective guesswork with better planning, better targeting, and better results.
New Ways to Understand Machine Learning Output
At Vidora, our mission is to make machine learning easier for everybody, and that means we look to do more than just automate the technically challenging parts of the machine pipeline. How to interpret the output and apply it to everyday problems is just as important. Everybody needs to understand what the numbers mean so teams can agree on an appropriate strategy and take the most calculated risks possible. The Vidora team is working tirelessly to expose new ways to make machine learning output meaningful and actionable, so keep an eye out for more exciting and innovative ways to understand your predictive results that are just around the corner!